Plots


Summary for 2026-04 (latest data 2026-04-14)
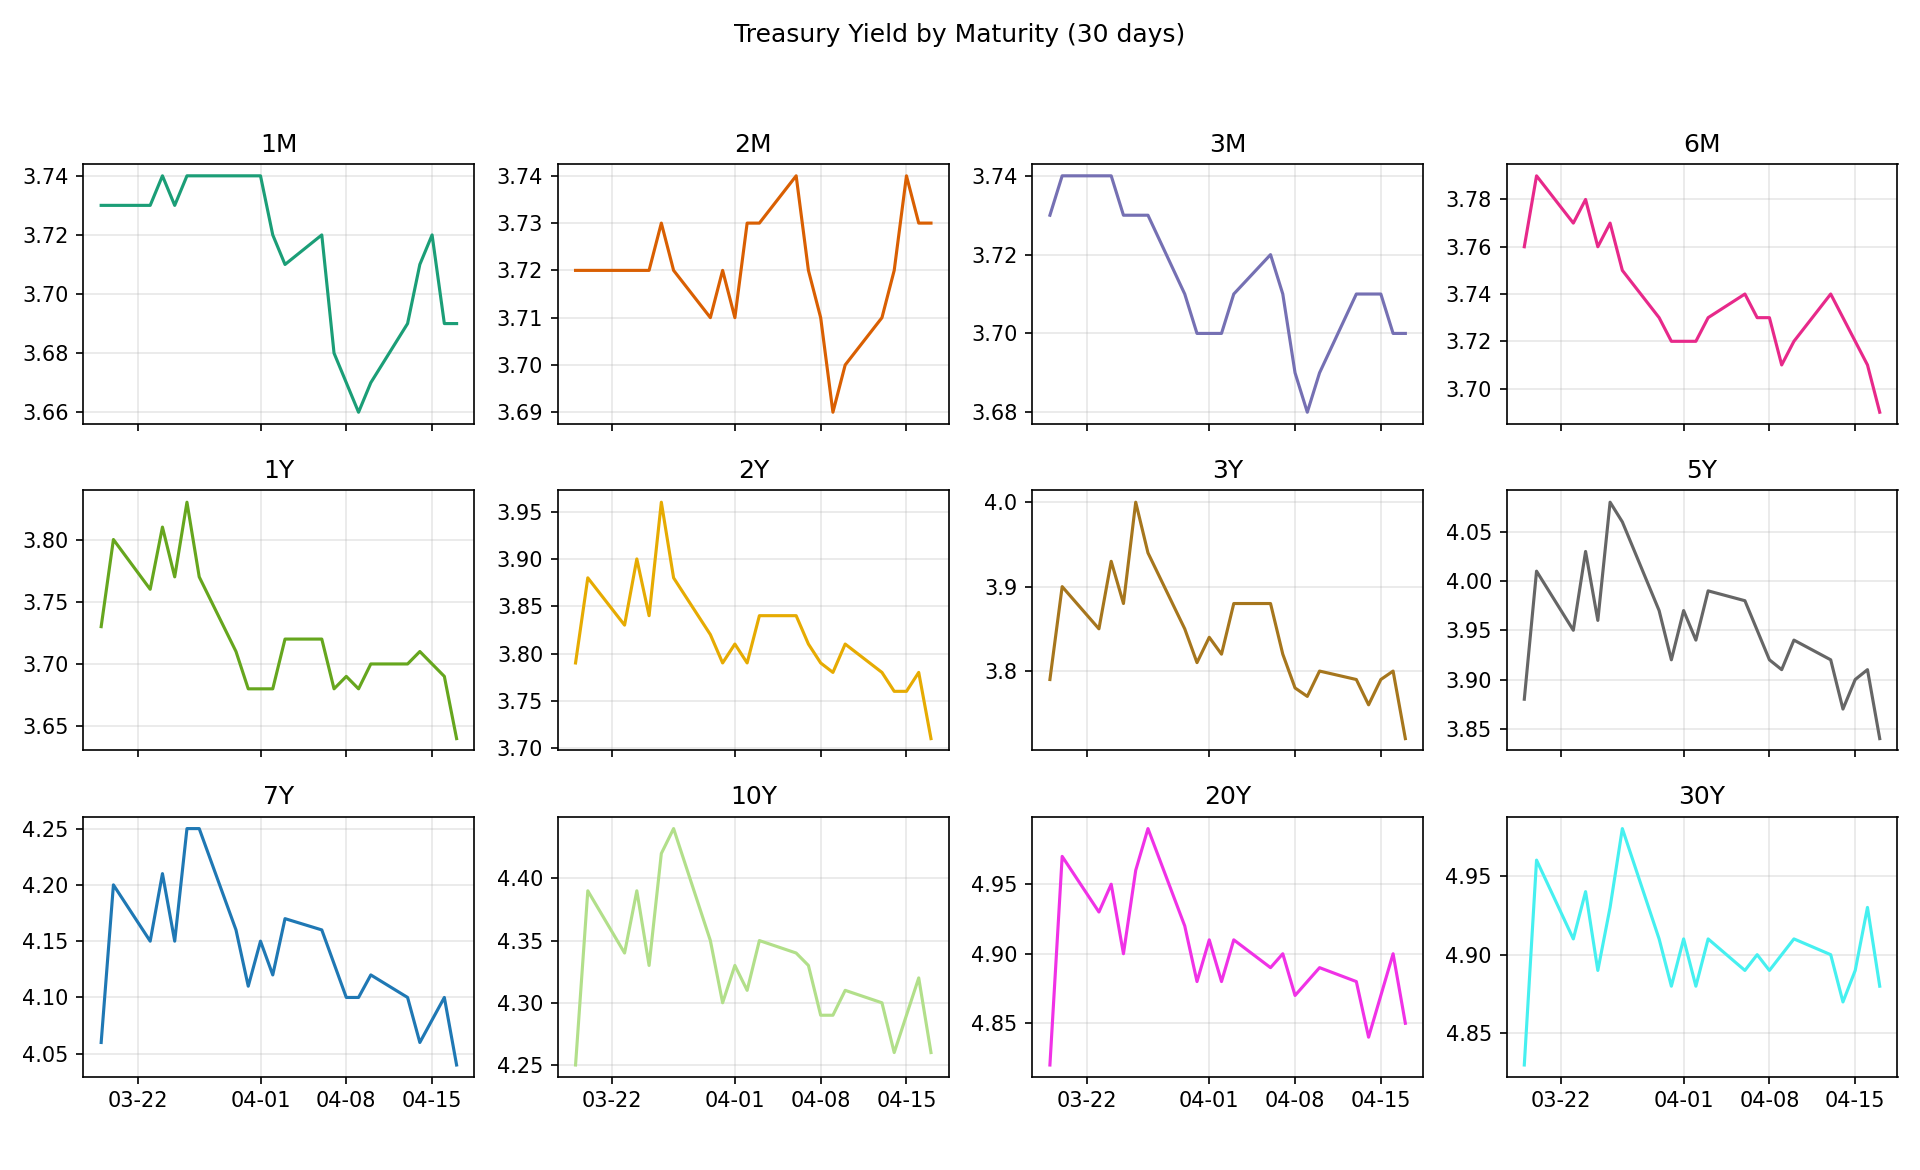
Highest current yield: 30Y (@ 4.87%)
Best annualized yield: 30Y (@ 4.87%/yr)
Best trend-adjusted yield: 30Y (@ 4.87%)
Best overall (composite): 30Y
Trend notes (bps/month, higher = rising yields):
- 1M: -9.9 bps/mo (R²=0.30), curr 3.71%
- 2M: -3.9 bps/mo (R²=0.14), curr 3.72%
- 3M: -0.3 bps/mo (R²=0.00), curr 3.71%
- 6M: +1.7 bps/mo (R²=0.07), curr 3.73%
- 1Y: +2.6 bps/mo (R²=0.05), curr 3.71%
- 2Y: -10.8 bps/mo (R²=0.37), curr 3.76%
- 3Y: -20.5 bps/mo (R²=0.51), curr 3.76%
- 5Y: -18.9 bps/mo (R²=0.60), curr 3.87%
- 7Y: -17.4 bps/mo (R²=0.60), curr 4.06%
- 10Y: -13.3 bps/mo (R²=0.52), curr 4.26%
- 20Y: -10.0 bps/mo (R²=0.50), curr 4.84%
- 30Y: -2.9 bps/mo (R²=0.10), curr 4.87%